The Manitou Web Client allows, those with permission, the ability to create custom Dashboards.
Creating a Dashboard
Click the Edit pencil on the Standard (default) Dashboard. 

Add a Layout

- Enter a description. This is how it displays across the top of the Manitou Dashboards.
- Set the shape and size of the layout.
- Merge or split as desired.
- Click Done.
Choose what to display
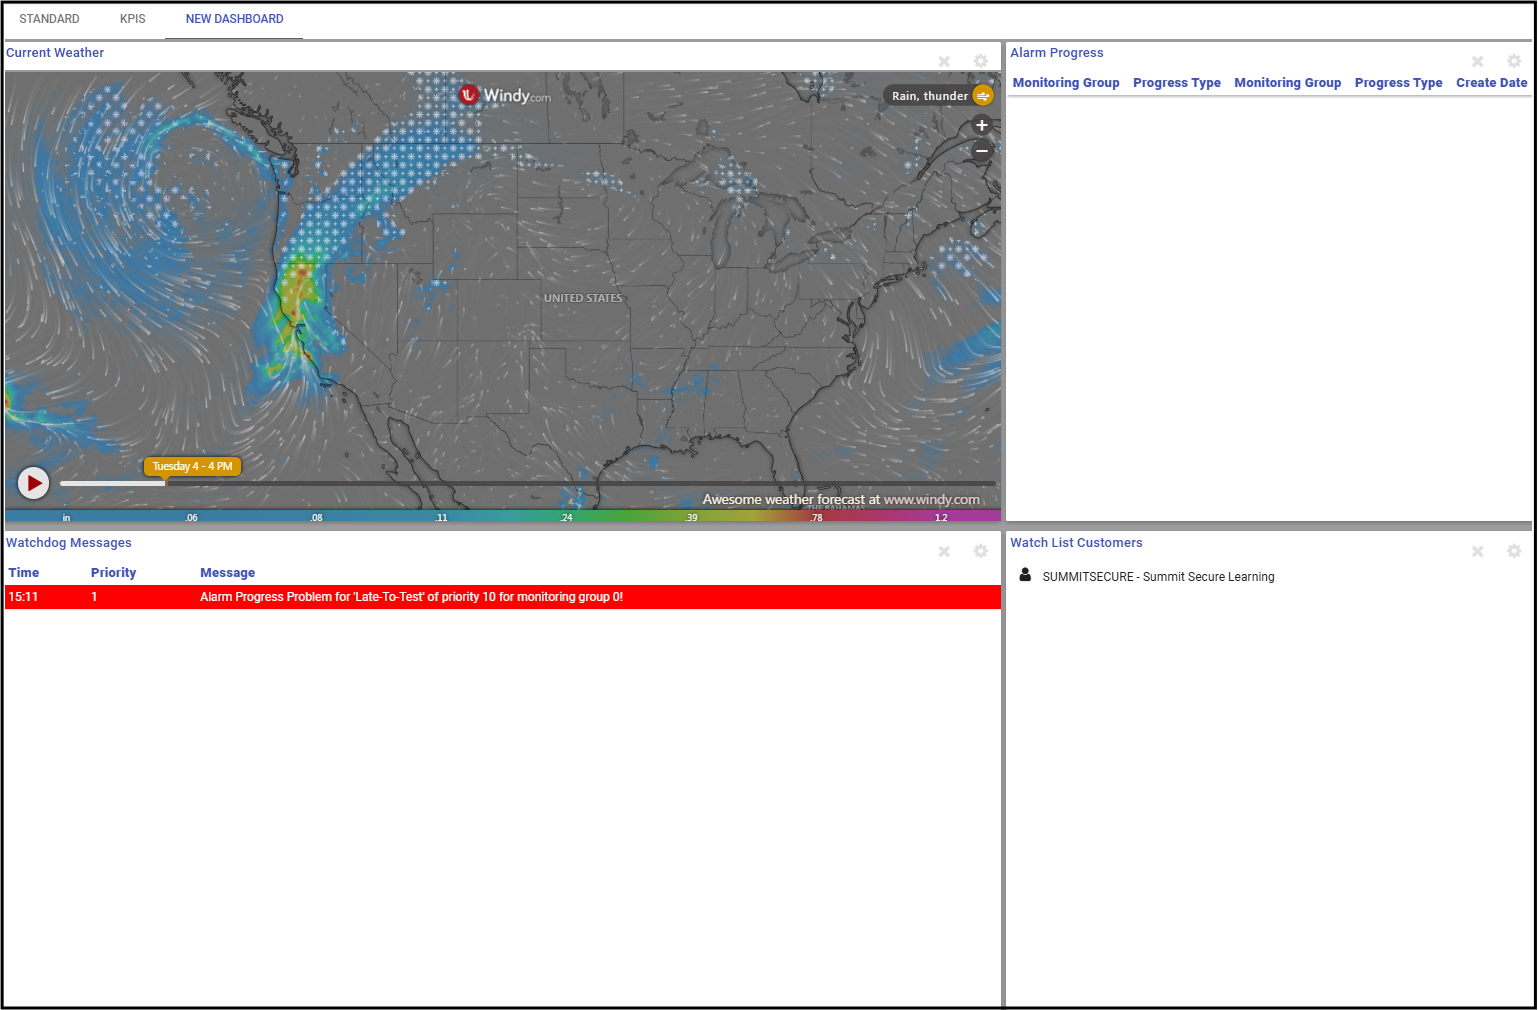
The new dashboard shows at the top of the Dashboards.
- Select the Dashboard.
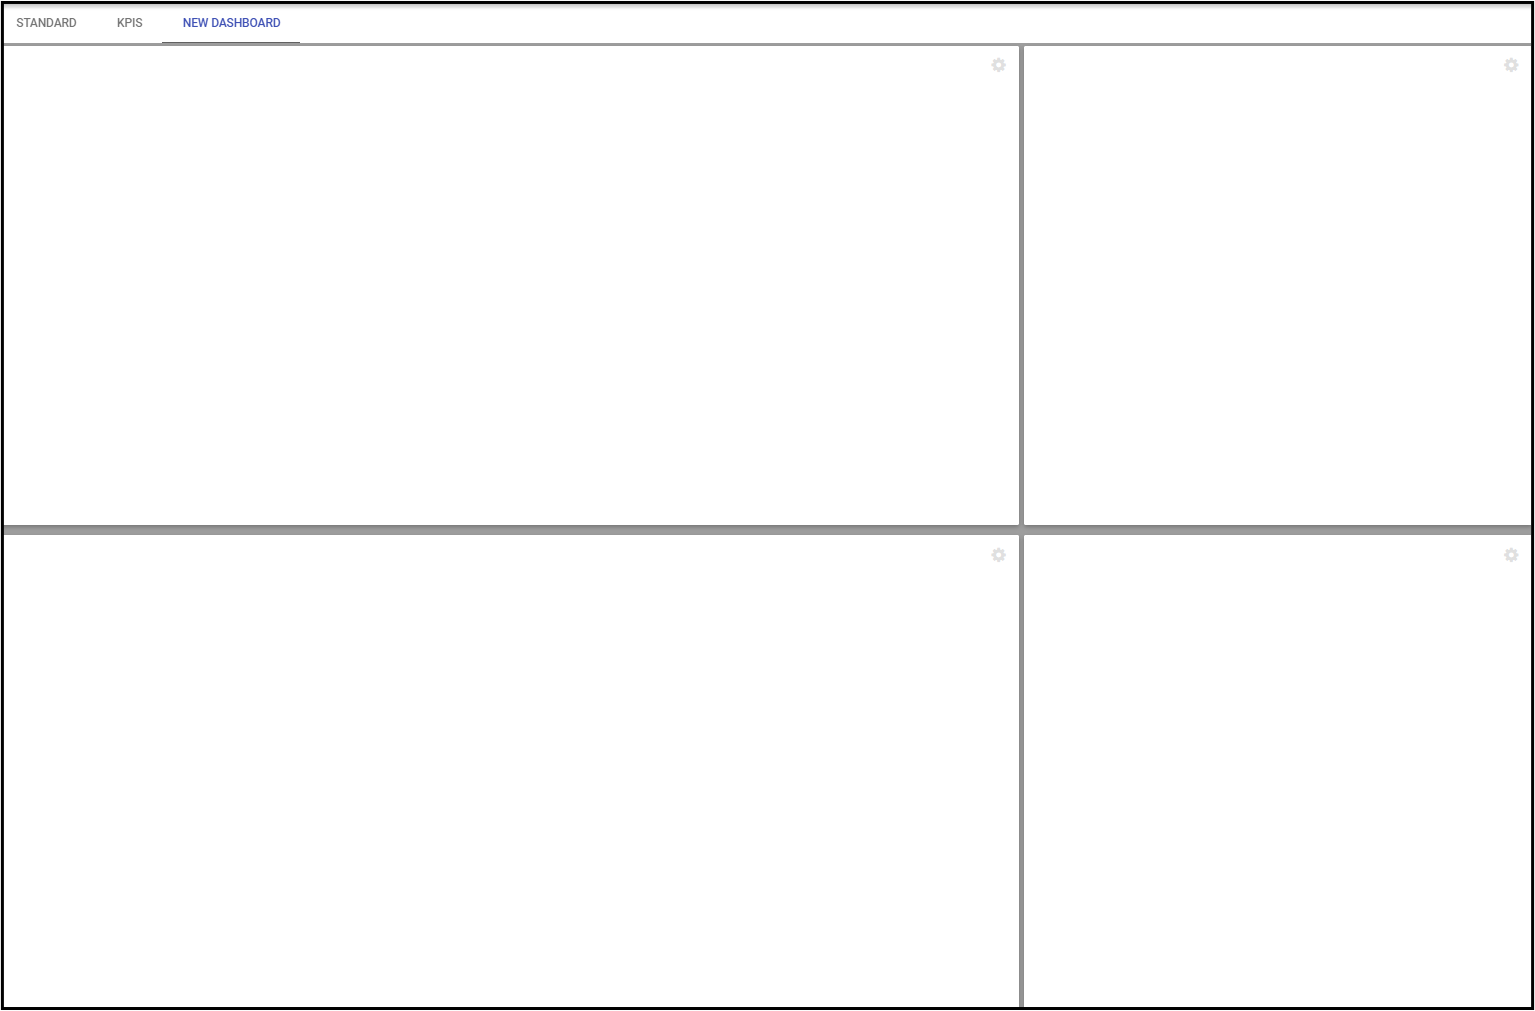
- Click the settings icon in the upper right-hand corner of each frame.
- Choose the item to include in the frame.
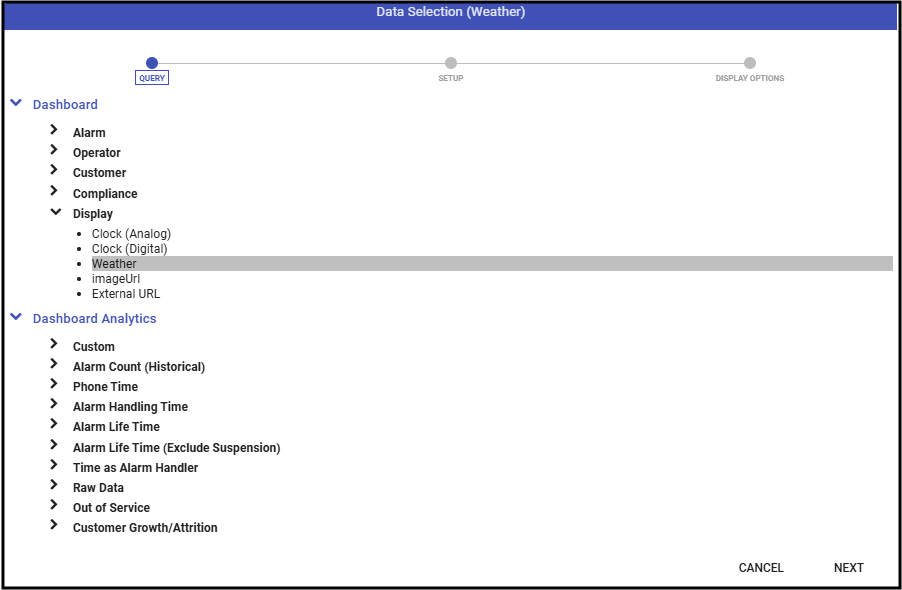
- Click Next.
- Configure the settings for the selected item.
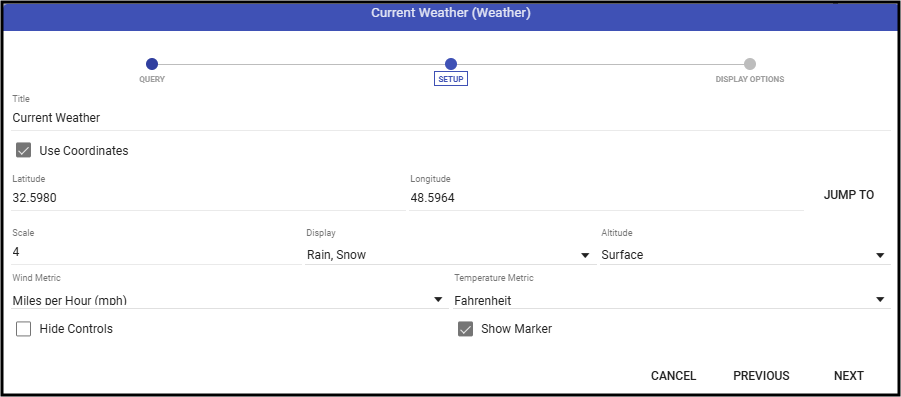
- Click Next.
- Configure any display options.
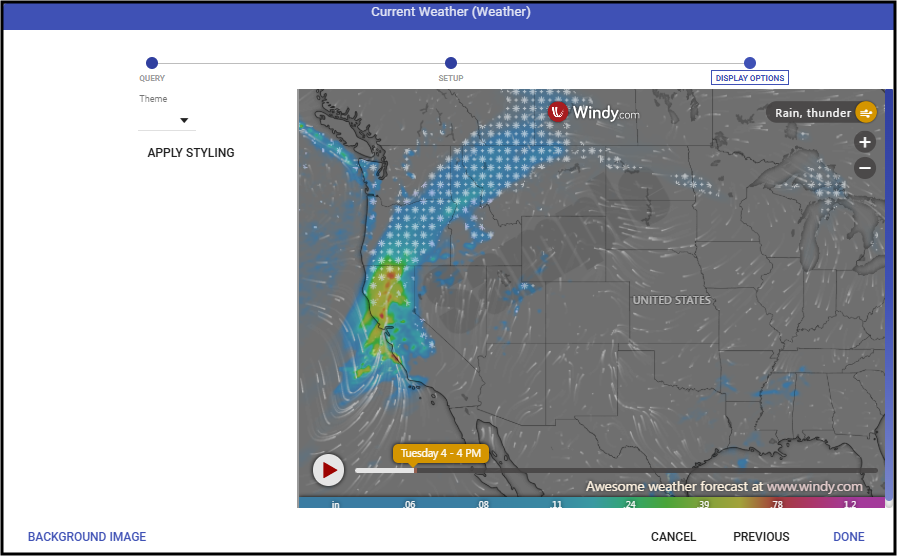
- Click Done.
- Repeat as needed for each frame.


Set Default Dashboard
If desired, users may select which dashboard they wish to load by default. 
- Click the Edit Pencil.
- Drop down the Default Layout drop down.
- Choose the dashboard to use.
- Click Done.